
The following images were taken using chapter 3 of 00MW-0009 The Test Disc, played back with a Sony HIL-C2EX, and decoded with a Sony MST-2000. They were photographed from the screen of a Hewlett-Packard 1740A analog oscilloscope with a rated bandwidth of 100 MHz, and a rated input impedance of 1 Megohm.
The order of the bars is White, Yellow, Cyan, Green, Magenta, Red, Blue, Black. White is 100%, but the remaining colors are not 100% (not specified).
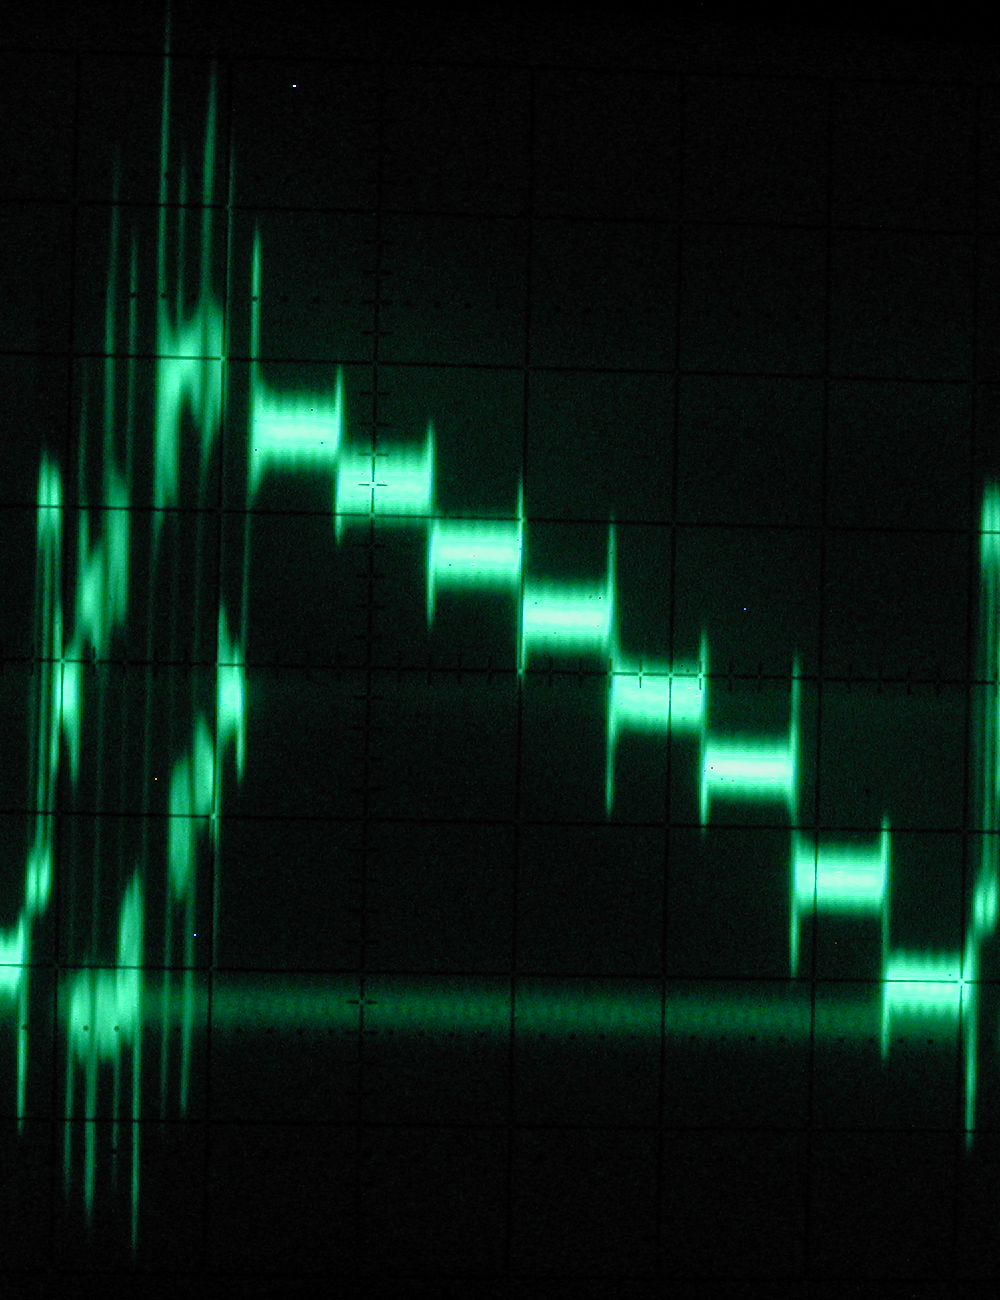
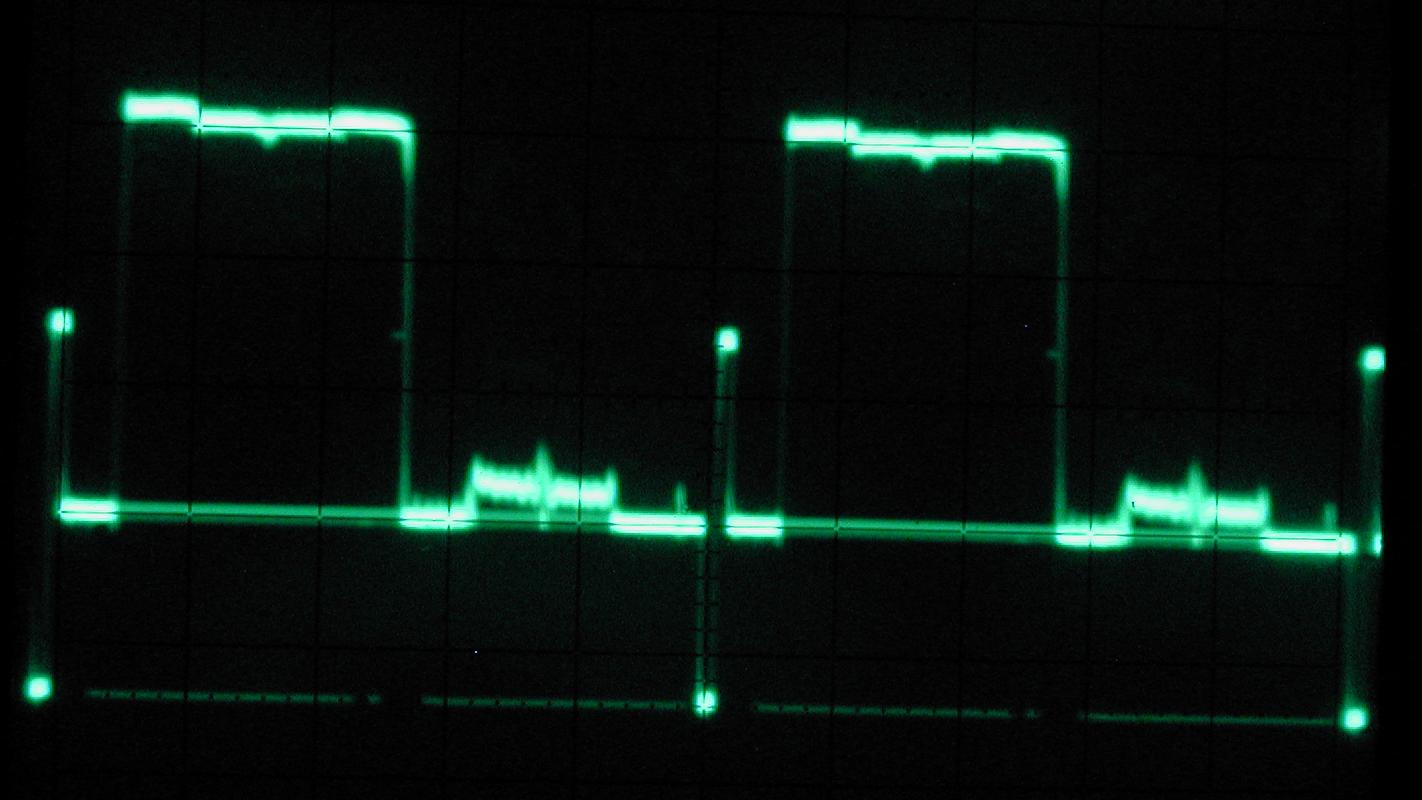
The MUSE waveform itself. The time-compressed luminance and line-by-line
alternating chrominance can readily be distinguished. Note the strong
emphasis peaks.
Higher quality (.PNG, 1.47 MB)

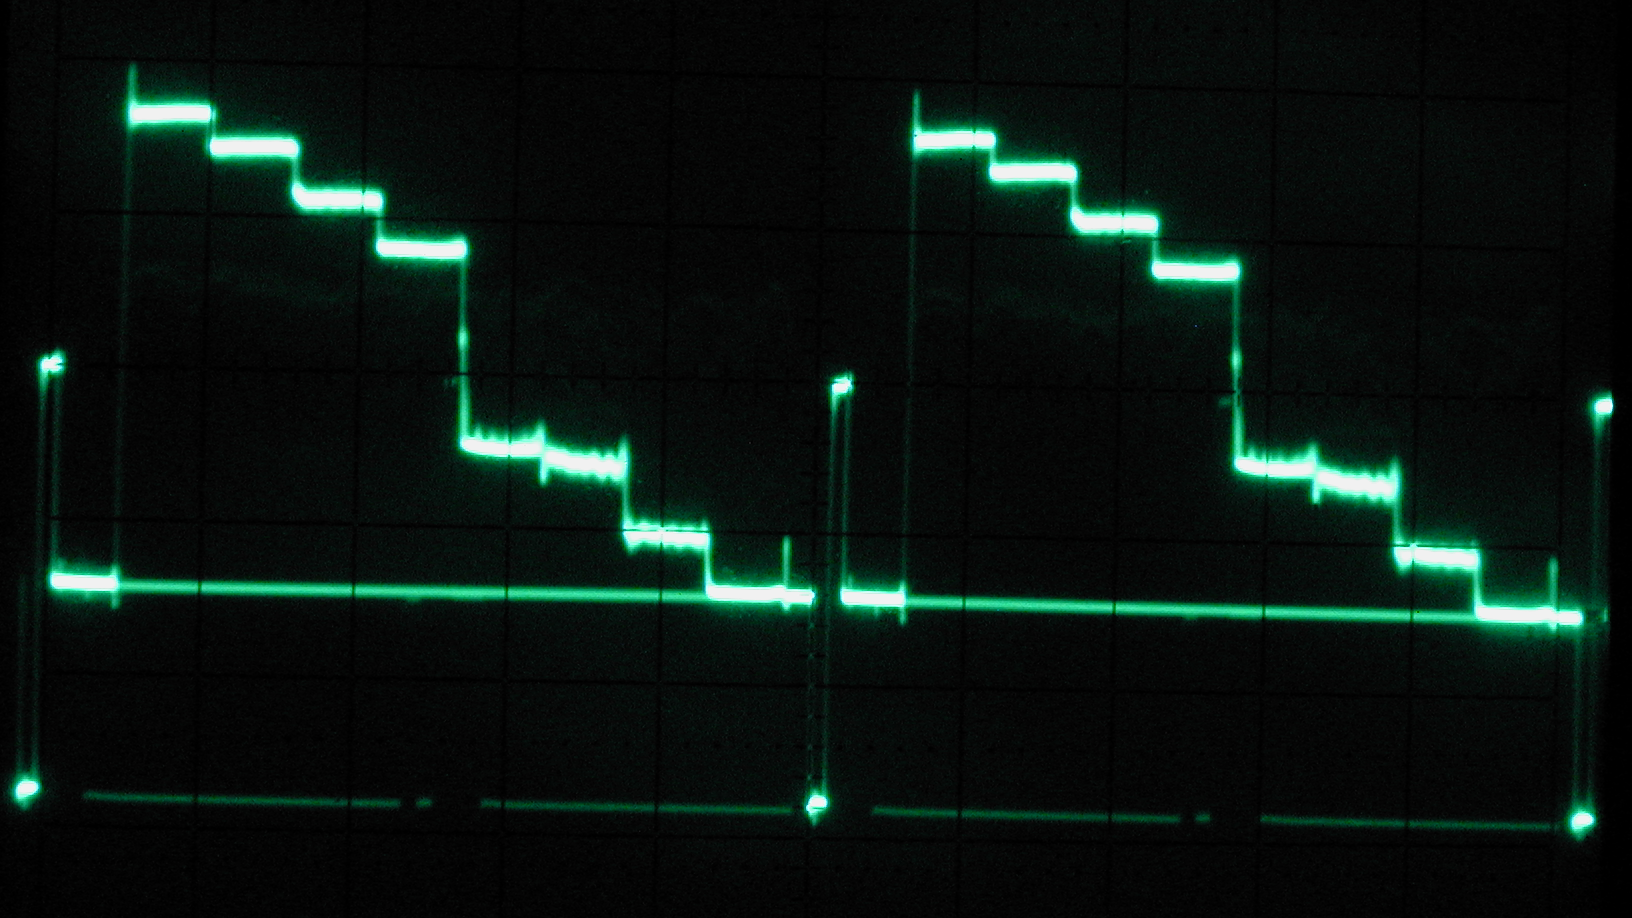
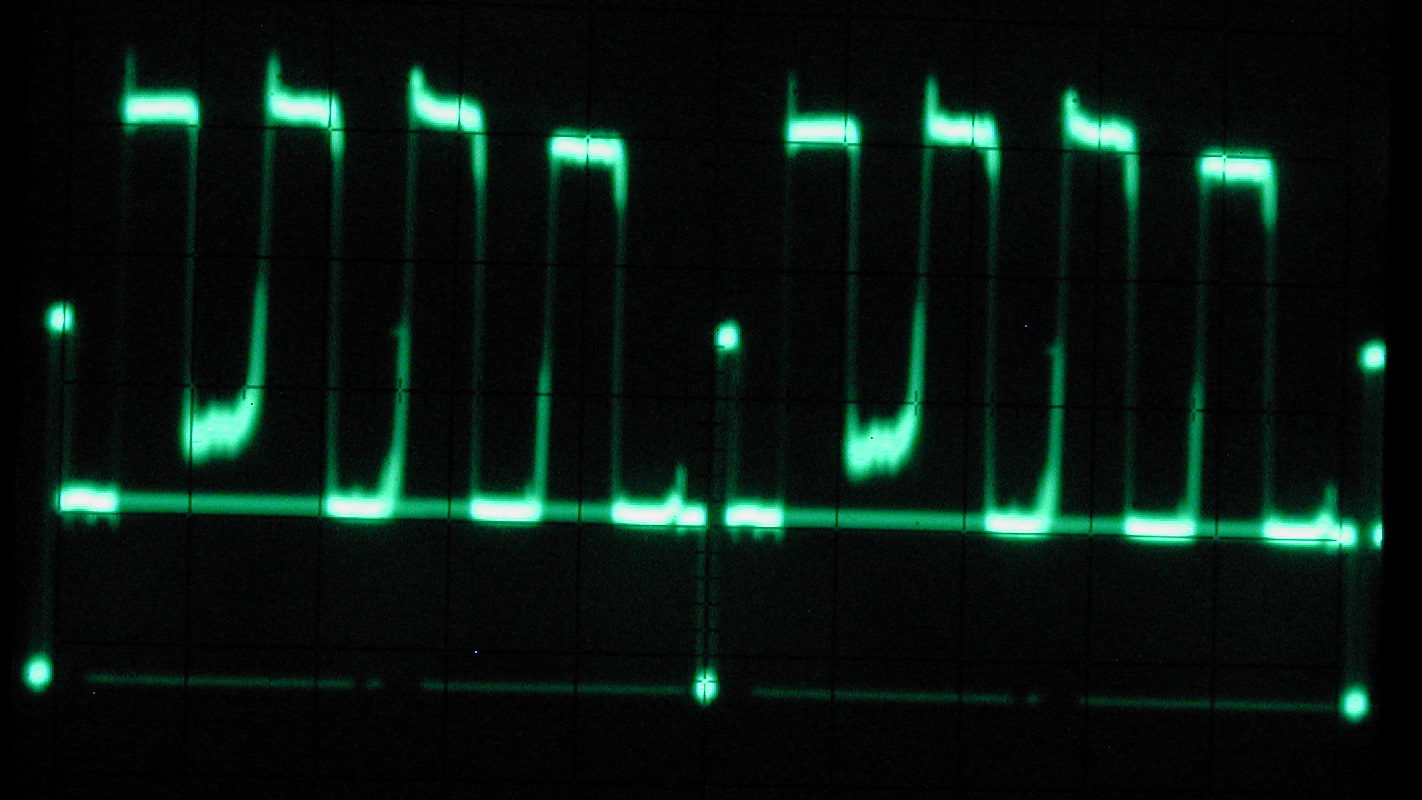
The decoded Y (luminance) waveform. 0.5 V/div vertical, approximately 6
microseconds/div horizontal.
Higher quality (.PNG, 1.52 MB)

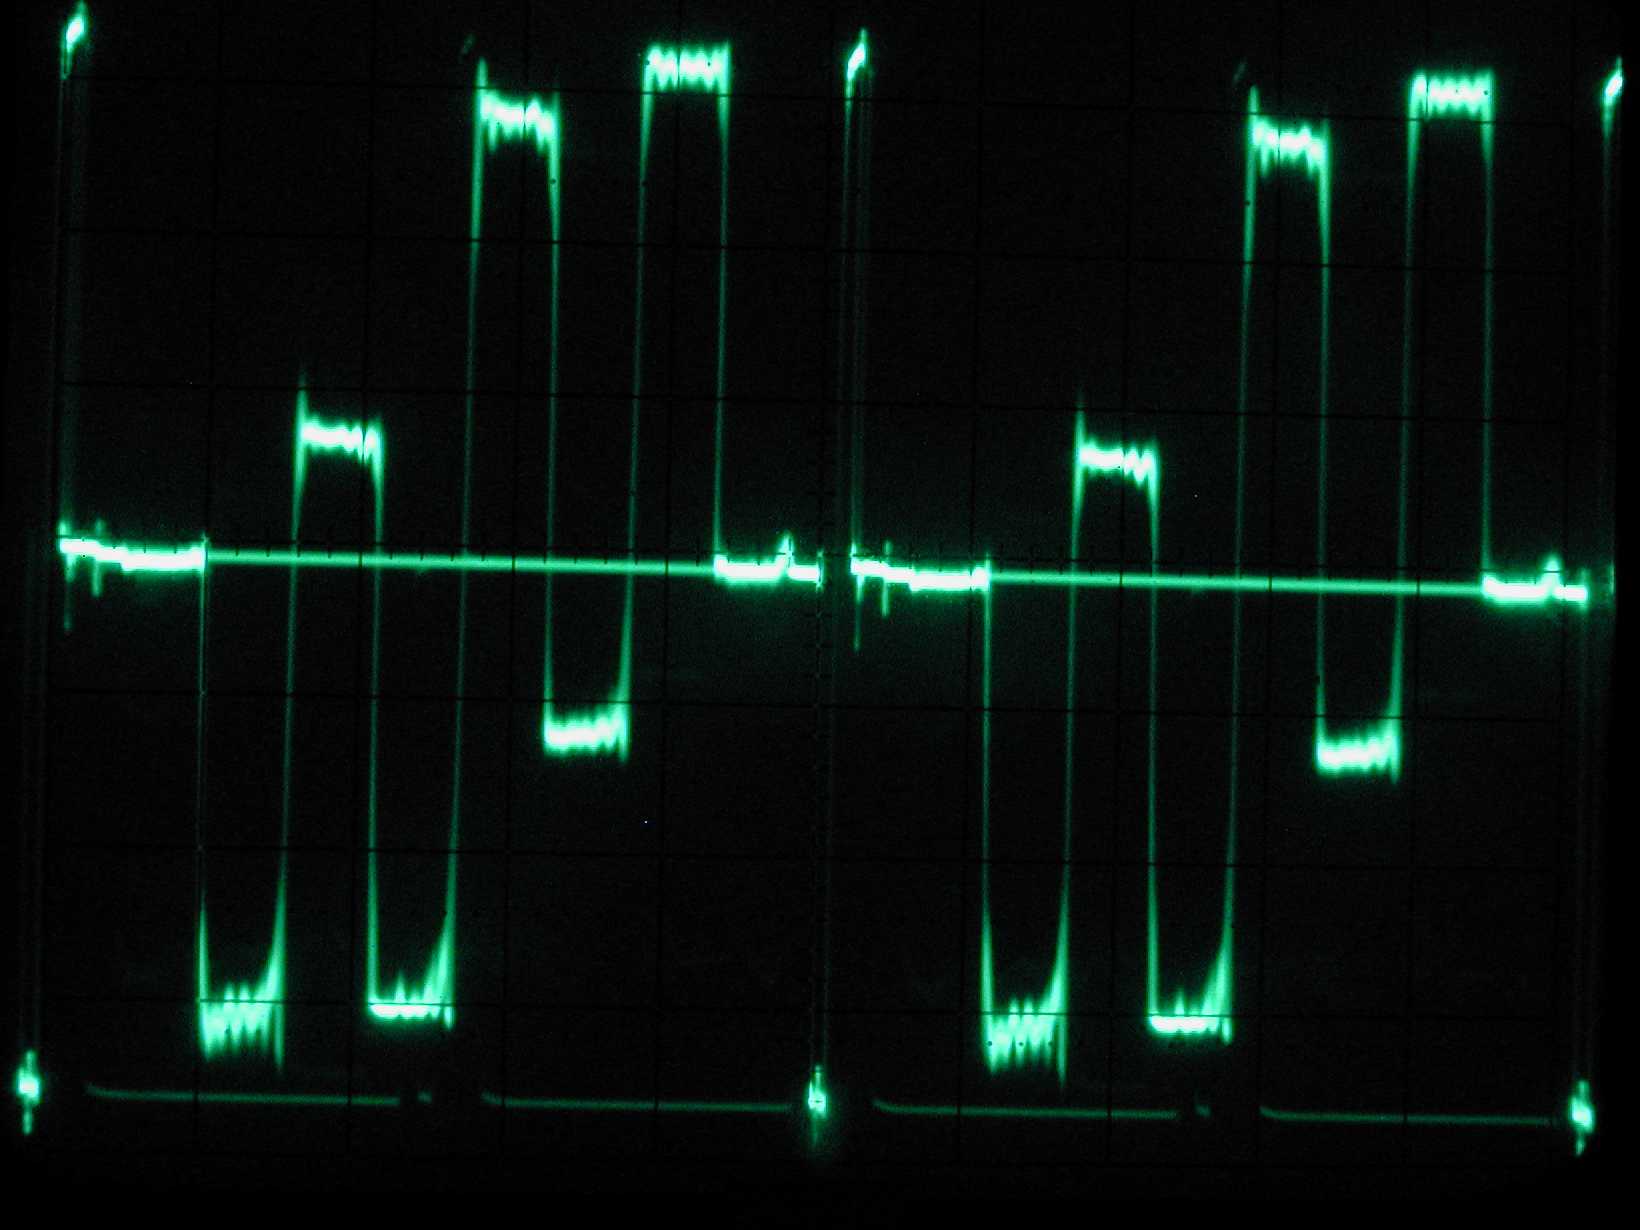
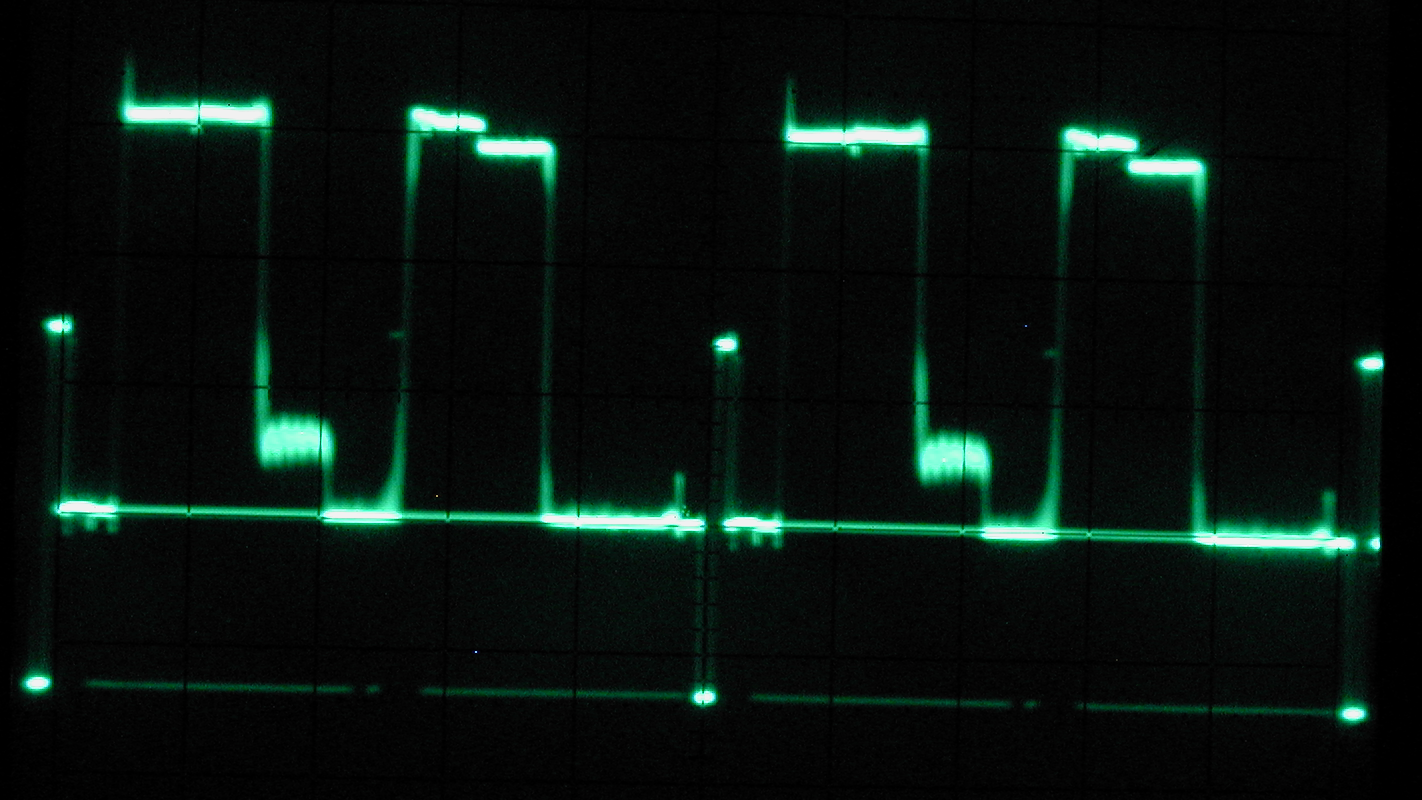
The decoded Pb (blue color-difference) waveform. 0.2 V/div vertical,
approximately 6 microseconds/div horizontal.
Higher quality (.PNG, 1.52 MB)

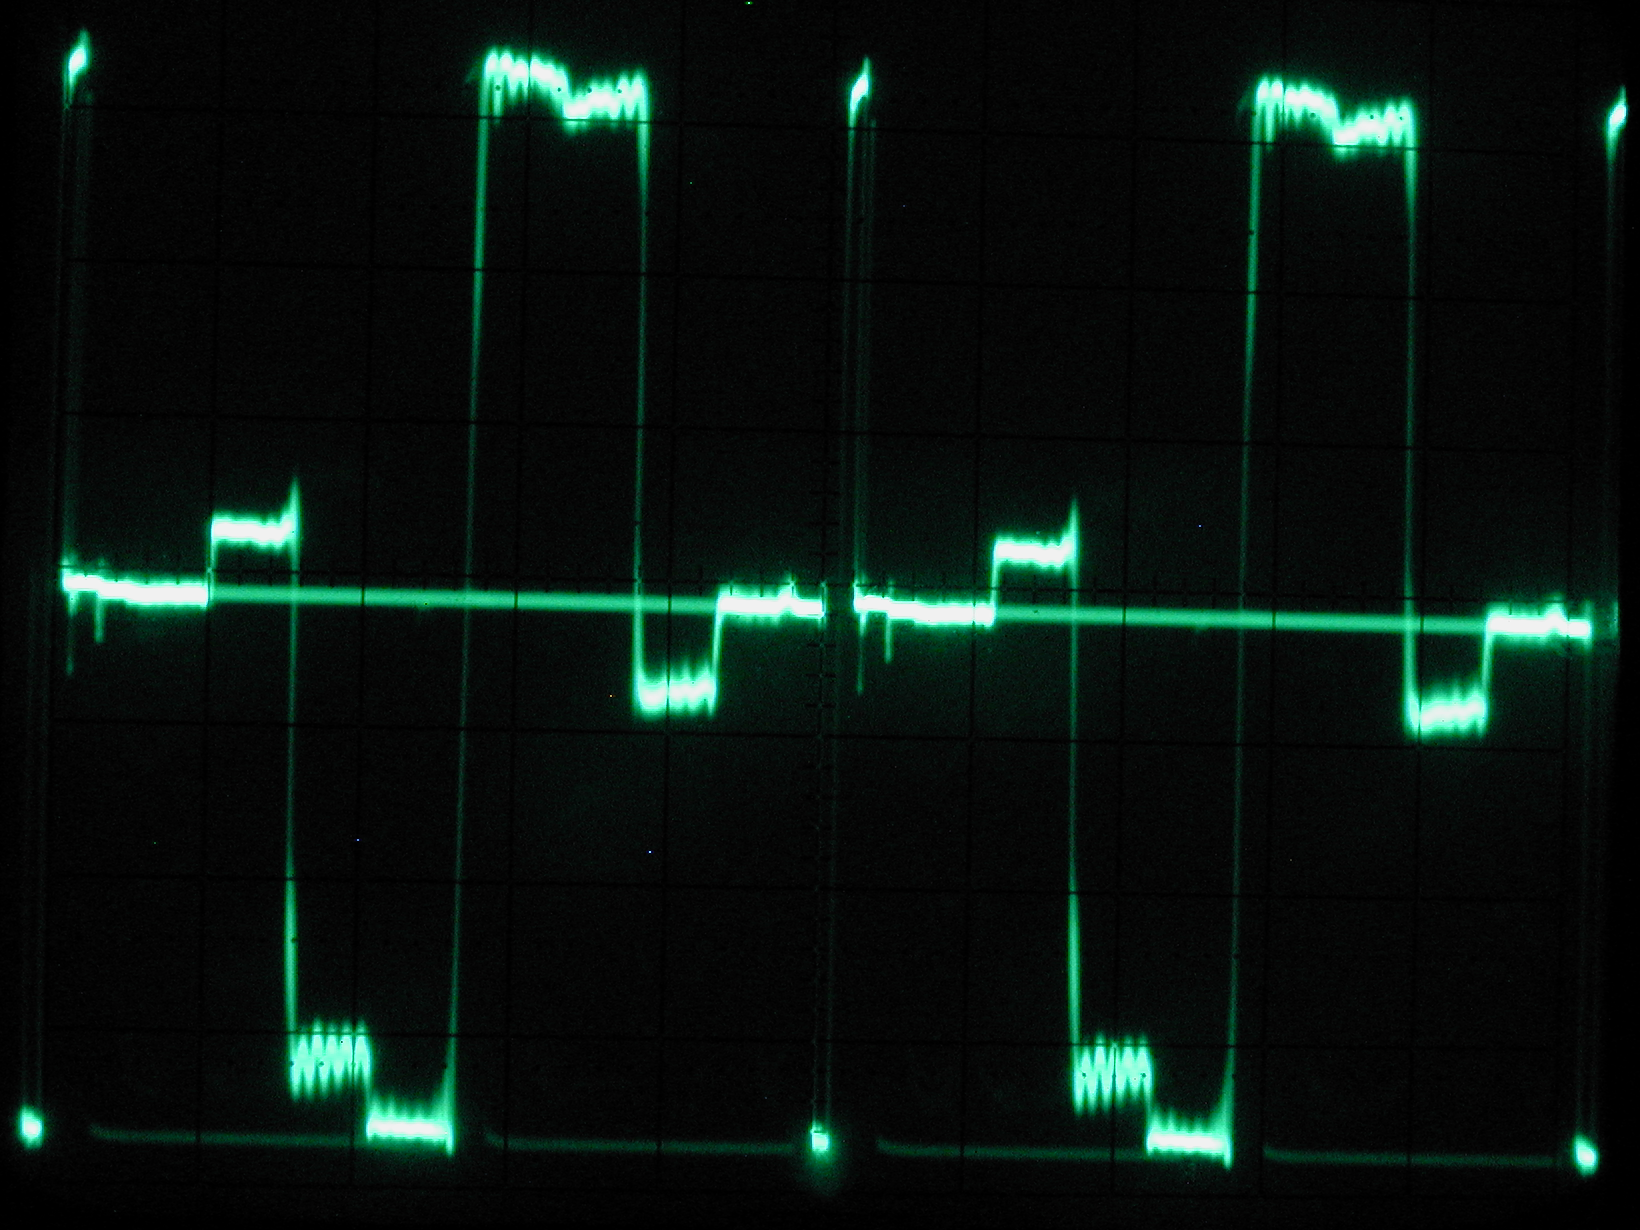
The decoded Pr (red color-difference) waveform. 0.2 V/div vertical,
approximately 6 microseconds/div horizontal.
Higher quality (.PNG, 1.52 MB)

The decoded G (green) waveform. 0.5 V/div vertical, approximately 6
microseconds/div horizontal.
Higher quality (.PNG, 1.52 MB)

The decoded B (blue) waveform. 0.5 V/div vertical, approximately 6
microseconds/div horizontal.
Higher quality (.PNG, 1.52 MB)

The decoded R (red) waveform. 0.5 V/div vertical, approximately 6
microseconds/div horizontal.
Higher quality (.PNG, 1.52 MB)